Data Collection & Analysis
DATA COLLECTION METHOD: ATTITUDE SURVEY

I conducted a brief attitude survey to gauge how students felt about writing, prior to the implementation of my action research and after. Many of my students had informally expressed that they did not enjoy writing, and I hoped to improve their attitudes through the implementation of our writing conferences and use of rubrics. This data collection method was selected to determine if attitudes toward writing would change after implementing my action research. The survey consisted of one question: Do you like writing? I hoped that through the use of the researched strategies, attitudes among my students would change positively. Additionally, I hoped that their attitudes would positively impact their writing achievement and stamina. During the study, students participated in one-on-one writing conferences and utilized rubrics as writing tools. The data collected during the course of the study suggested that attitudes among students improved. Therefore, I decided to continue implementing the researched strategies through the school year. Since attitudes continued to improve throughout the study, I did not stop conferencing or encouraging students to use rubrics as writing tools. While they expressed difficulty in using the rubrics at first, they grew more comfortable.
|
|
DATA ANALYSIS: ATTITUDE SURVEY
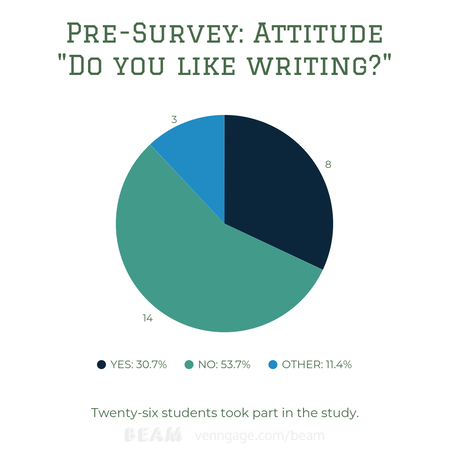
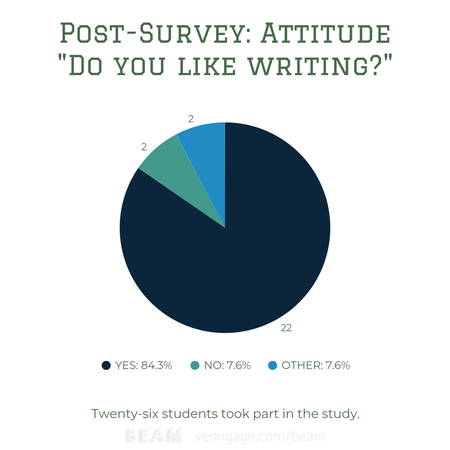
The pre-survey graph and post-survey graph represent how the answers of my students changed prior to the implementation of the researched strategies and after. In the first graph, 54.7% of my students (or 14 students) responded negatively, 30.7% (or eight students) responded positively, and 11.4% (3 students) responded neutrally. These numbers were not surprising due to the attitudes and effort toward writing that I had previously seen. This graph served as my baseline in reference to student attitudes toward writing. The second graph represents student attitudes after I had incorporated regular writing conferences focused on the content of writing in addition to the use of rubrics as writing tools. In the graph, 84.3% (or 22 students) responded positively, 7.6% (or two students) responded negatively, and 7.6% (or two students) responded neutrally. Positive responses grew by 53.6% which implies that the strategies implemented improved attitudes among writers. I informally took note of attitude changes throughout my action research. Some students were displeased at the idea of trying new writing strategies at first.
While attitudes improved for many students, there were some who I struggled to reach during implementation. Some students struggled to open up about the content of their writing. These students benefited less from one-on-one conferences, due to lack of effort and engagement. Additionally, snow days made it difficult to complete conferences in the timeframe I had planned. I shortened conferences in order to complete writing assignments on time. Therefore, some students got less time to conference one-on-one. Among the students who got less time for conferences, three students responded negatively to both surveys. Still, prior to implementing the strategies, over half of my students did not enjoy writing. After implementation, over 80% expressed enjoyment in writing. The data provides evidence to support that incorporating regular one-on-one conferences focused on the content of the writing along with the use of rubrics as writing tools improved student attitudes toward writing. The data collected made me question how student attitudes would have been different if I had implemented the researched strategies at the beginning of the school year.
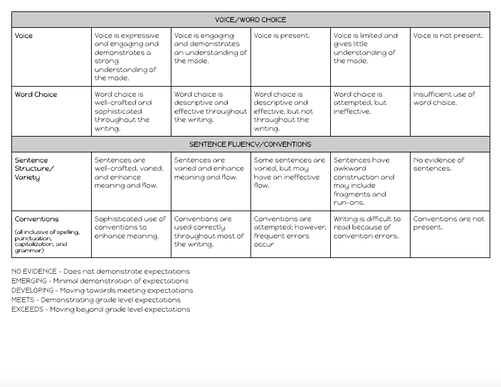
DATA COLLECTION METHOD: WRITING SCORES
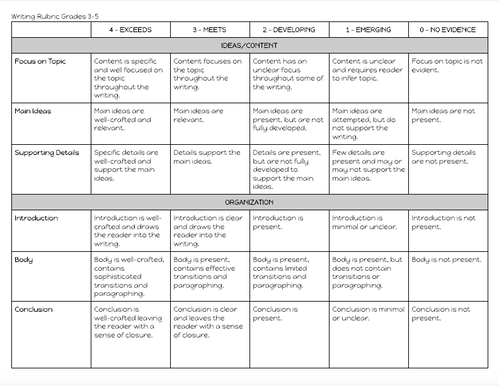
In order to see the effects of the new writing strategies, I graded three pieces of writing on the same four-point scale. Students were able to score a total of 40 points if they exceeded expectations in each of the ten categories. The scoring criteria included “meets”, “developing”, “emerging”, and “no evidence”. The categories focused on ideas/content, organization, voice/word choice, and sentence fluency/conventions. The first piece of writing was completed and graded prior to the implementation of my researched strategies and served as an unofficial baseline score. They finished this piece the day before I implemented the new strategies.
The second two pieces were graded during and after implementing my researched strategies. This data was collected to see whether the implemented strategies would result in growth from all students in writing achievement. The first piece was informational writing, the second was personal narrative writing, and the final was creative writing. I graded all pieces of writing on the same scale and according to the rubric students used to self-assess during the writing process. After scoring the second piece, it was encouraging to see growth from the first pieces to the second pieces. I had proof that the implemented strategies were improving achievement in writing. Therefore, I knew that I needed to continue meeting with students consistently and encouraging the use of rubrics as writing tools. I decided to spend more time teaching students how to effectively use the rubrics based on feedback I received from students during one-on-one conferencing. The feedback informed me that students felt unsure about self-assessment.
DATA ANALYSIS: WRITING SCORES
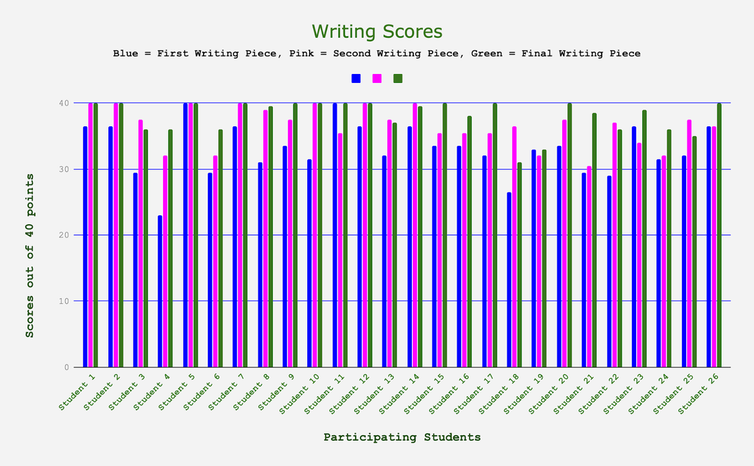
The bar graph depicts writing scores on three writing pieces. The first scores (in blue) represent the first piece of writing. The instruction and writing process took place prior to implementing my action research. The first score represents my baseline. The second scores (in pink) represent the first piece of writing completed during my action research. The third scores (in green) represent the final piece of writing students completed while taking advantage of the researched strategies. Students had conferenced with me individually and used rubrics as writing tools throughout the writing process. The data indicated that overall, students improved in writing achievement based on their writing scores. In fact, 25 students made growth from the first piece to the final piece. One student achieved the same score on the first and final piece. Student 4 made the biggest growth, initially scoring a 23 and finishing with a 36. On the first piece of writing, two students achieved 40 points (100%). On the second piece, seven students achieved 40 points. Finally, on the third piece, 12 students achieved 40 points. This data point suggests that 10 more students achieved mastery of fifth grade writing standards after implementation of the new strategies. Further, the average score of the first piece was 33/40 points.
The average score of the final piece was 38/40 points. While every student grew from the first piece to the final piece, some students scored higher on the second piece than they scored on the third piece. For example, Student 18 scored a 36.5 on the second piece and fell to a 31 on the third piece. It must be considered that due to snow days, writing conferences were shortened by about three minutes between the second and third pieces. Additionally, the three pieces differed in writing genre. Between the second and third pieces, students grew more confident as writers. Most students were able to tell me more about their writing during one-on-one conferences. One student shared positive feelings when he compared his first piece to his final piece in sharing, “I can’t believe how much more I can write now!” I noticed significant growth in supporting ideas with details. Additionally, students were using more transition words and their ideas flowed from one paragraph to the next. I was most impressed with their improvement in voice. As a whole, their writing became more expressive and engaging. After implementation, I wondered how much improvement came from the rubrics and how much came from one-on-one conferencing. I questioned how successful each of the individual strategies would be. For example, would students be as successful if they had practiced self-assessment with rubrics, but had not conferenced with me?
DATA COLLECTION METHOD: OBSERVATION DATA
My students frequently asked questions relating to finishing their pieces. They needed regular guidance in reference to how much writing they needed, how close they were to finishing, and whether or not they needed to add more details. Due to these informal observations, I took formal observational data to determine how their writing confidence and stamina would change due to one-on-one conferences and rubrics as writing tools. The observation data was completed by tallying each time a student asked a question along the lines of, “Do I have enough?” I took data each day during writing. The first and second weeks of observation data, I noticed that I was still getting many questions regarding the completion of writing pieces. I decided this was a good time to implement student-to-student conferences based on the data I had collected. I created groups of three and students were directed to read their pieces to each person in their groups. The groups would then assess the writing pieces on the rubrics pointing out areas of growth (two) and positives (two). I think these conferences greatly decreased the amount of questions I was getting. Additionally, I was conferencing the entirety of student work time. Therefore, students had less time to ask questions. While I saw a decrease in questions as time went on, I wonder how much the student-to-student conferences impacted the observation data. It would also be interesting to see which strategy impacted students most.
DATA ANALYSIS: OBSERVATION DATA
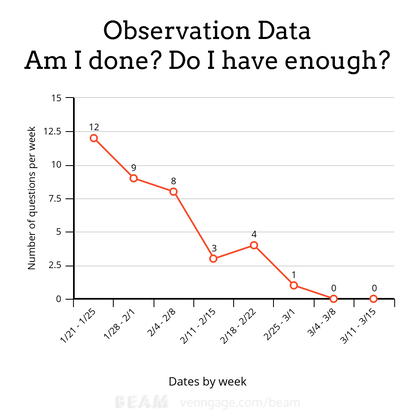
Observation data began the week of January 21 to serve as pre-implementation data. That week, students were finishing their first writing pieces which served as the baseline piece of writing. Throughout my observations, the type of questions that students asked did not change. The questions included language such as, “Am I done?”, “Do I have enough?”, How many paragraphs do I have to have?”, “How much more do I need?”, and “Do I have enough details?” The first week, I observed 12 questions along those lines. It is important to note that this was the week of a due date and students wanted to feel confident about the work they were turning in. About halfway through the study (during the week of February 11) I observed three questions along the same lines. This data point was encouraging and led me to believe the implemented strategies were effective in decreasing questions pertaining to completion.
The last two weeks of the study, I observed zero questions pertaining to the length of their writing. At this point, I felt strongly that student confidence had grown drastically based on the data gathered. Overall, the difference between the first week and the last week was 12 questions. This difference provides evidence to support the strategies implemented. The first week of a due date, there were 12 questions pertaining to length. The second week of a due date, there were four. The week of the final due date, there were zero. The general trend suggests that the writing conferences and rubrics as writing tools decreased the amount of student questions regarding the length of writing pieces. While it is difficult to determine which strategy decreased student questioning the most, it seems that the strategies combined were successful. The increased confidence among students during writing most likely had a lot to do with the decrease in questioning. Additionally, students had a specific time with me to discuss their writing as opposed to pulling me for questions throughout the writing process. While the data provides evidence to support the success of the implemented strategies, there were factors that raise questions. I wonder how much my conferencing throughout the writing block impacted questioning. Due to the strained snow day schedule, I had much less time for students to freely ask questions. In addition, the student group conferencing could have been extremely beneficial, but I was not very involved in the process.
TRIANGULATION
Each data point provides evidence to support growth in writing achievement, stamina, and attitude among students as a whole. The results of the attitude survey are most likely directly tied to the results of the observation data. As attitudes grew more positive through the implementation of action research, students grew more confident about their writing. The rubric allowed students to self-monitor through the writing process which led to less questioning. Students knew exactly what was expected of their writing pieces. Further, conferencing gave each student time to work through problems with me. They were not getting stuck in the content of their writing. Additionally, they were able to write more based on our conversations about the content. Their writing stamina increased due to more confidence and more positive attitudes. Growth in attitude and confidence (as per the attitude survey and observation data) resulted in higher scores on their writing pieces overall. Students wrote more (and for longer periods of time), provided details to support their ideas, and consistently turned in more complete writing pieces.